Australian Property Market Trends
November 2024 – National Review
The annual capital city change in house and unit values for the month of November are:
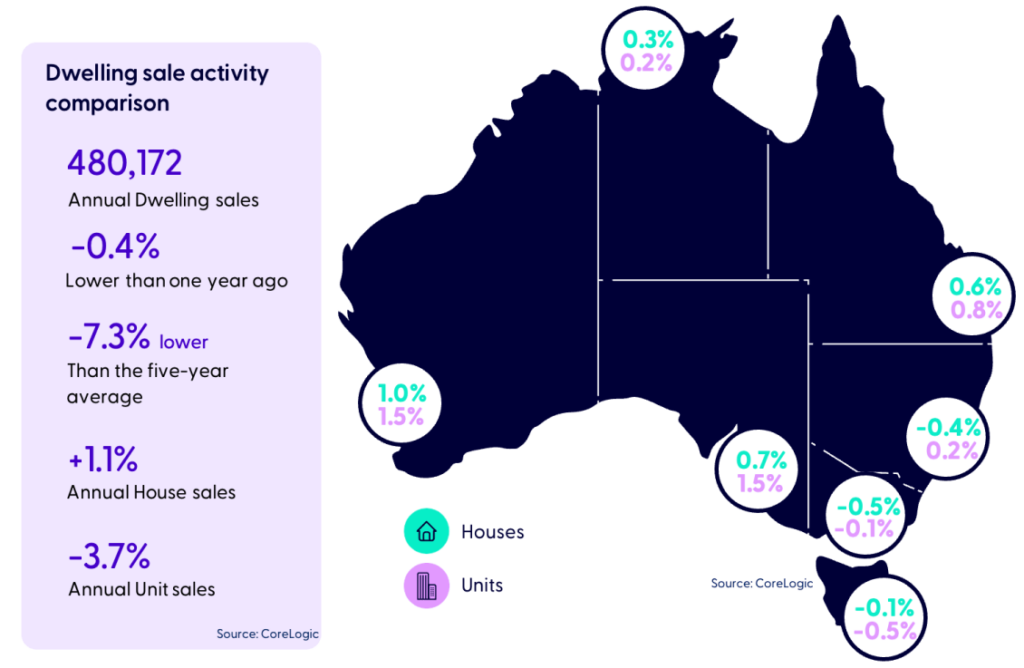
- 480,172 annual dwelling sales
- -0.4% lower than one year ago
- -7.3% lower than the five-year average
- +1.1% Annual house sales
- -3.7% Annual unit sales
The national housing market recorded a slight +0.1% rise in November, the weakest Australia-wide result since January 2023.
CoreLogic’s national Home Value Index (HVI) recorded a +0.1% rise in November, the twenty-second consecutive month; however, this could be close to the last cycle. Weaker housing conditions have been accompanied by a rebalancing in available supply as selling activity lifted through spring. At the same time, purchasing activity has moderated, with capital city home sales over the past three months easing -4.6% lower than a year ago.
The slowdown in the dwelling value growth rate reflects weaker housing conditions and increased listing levels during spring, which provided buyers with more choice than at any time over the last six years in Sydney and Melbourne and improved listing levels in other capitals.

Market Outlook
- Listings are up for houses (8.1%) and up for units (8.9%) nationally
- Houses spent 38 days on the market on average, and units on the market for 37 days on average
- Vendor discounts was -3.6% for houses and -3.2% units
- Median value of houses nationally was $876,977 and units was $670,398

What’s Hot – National Suburb Annual Change
- #1 – Swan (WA) – 26.0%
- #2 – Mundaring (WA) – 24.6%
- #3 – Wanneroo (WA) – 24.3%
- #4 – Cockburn (WA) – 24.0%
- #5 – Kwinana (WA) – 23.9%
- #6 – Stirling (WA) – 23.6%
- #7 – Kalamunda (WA) – 23.5%
- #8 – Bayswater – Bayswater (WA) – 22.5%
- #9 – Rockingham (WA) – 22.3%
- #10 – Serpentine – Jarrahdale (WA) – 22.2%

Final outlook
The outlook for housing markets has moderated over the past month, with core inflation holding high, labour markets holding tight, and the likelihood of an interest rate cut at the start of the year less than certain. Rising advertised stock levels, a slowdown in purchasing activity and a loss of momentum in value growth among the large and mid-sized capitals are emerging as the main takeaways for the property market towards the end of 2024.
An undersupply of newly built housing is likely to support housing values. Given the highly ambitious target to build 1.2 million homes and an upcoming federal election, the potential for new supply-side stimulus policies to kickstart residential construction activity is highly likely in 2025. Interest rate cuts are expected to increase activity, improve confidence, and shore up softening conditions. 2025 is expected to be a year of two halves, with continuing softening in housing market conditions and more muted demand until interest rate falls occur.
Looking to buy a home or invest in property?
Get in touch with us to get a state or suburb specific property report to help with your property journey.
Call us on (02) 9058 7404.
Disclaimer – The information contained in this publication is gathered from multiple sources believed to be reliable as at the end of November 2024 and is intended to be of general nature only. It has been prepared without taking into account any person’s objectives, financial situation or needs. Before acting on this information, ubank recommends that you consider whether it is appropriate for your circumstances. ubank recommends that you seek independent legal, property, financial, and taxation advice before acting on any information in this publication.
Find our past publication here: [Feb 2024] [Mar 2024] [Apr 2024] [May 2024] [Jun 2024] [Jul 2024] [Aug 2024] [Sep 2024] [Oct 2024]
